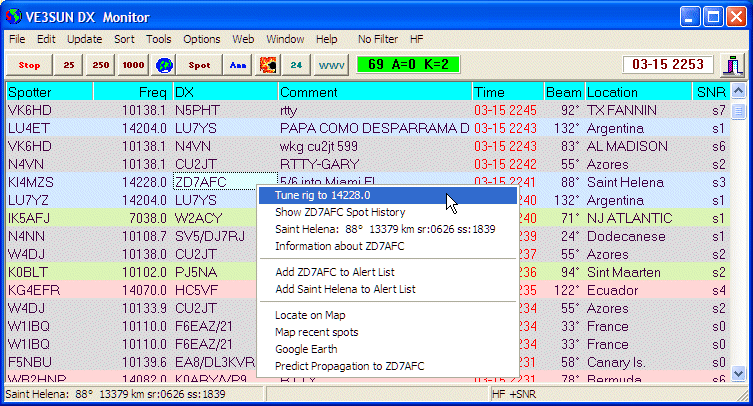
How to Work a DXpedition Intelligently
Download the latest DX Monitor
Working a DXpedtion is mainly a question of calling at the right time on the right frequency. DX Monitor can help you to do this in a number of ways. Follow these steps and ZL8X will be in your log in no time.
Step 1
Check the Propagation forecast from your exact QTH to the DXpedition Station so you can be on when propagation peaks.
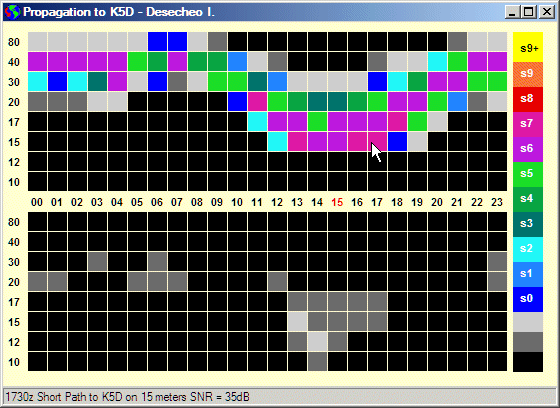
Propagation from Europe to K5D
DX Monitor creates a simple graphic propagation forecast based on your antennas and power level and calculated by VOACAP using the latest smoothed sunspot number information. Use this chart to choose your operating times. It would be a good idea to take the afternoon off work.
Step 2
Look at the operating history of the DXpedition so you can hear them before the pileup starts.
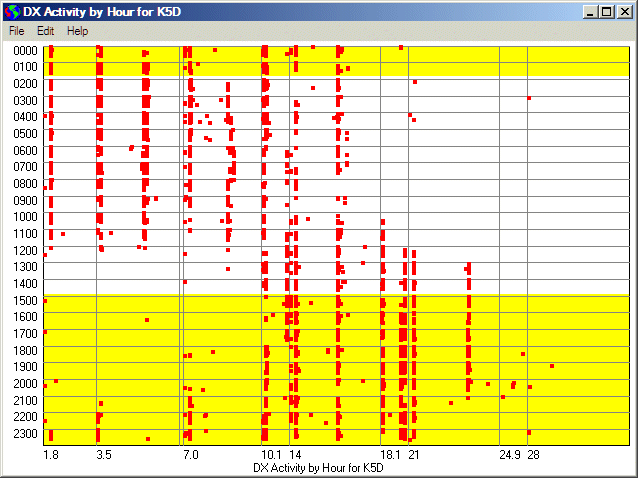
K5D Activity by Frequency - the first 3 days
The scatter chart of activity shows you the time that the DX station operates daily on each band. Be there before the first spot appears to have a better chance of getting through.
Step 3
Know the exact frequencies that they are likely to use. The frequencies they have been heard on.
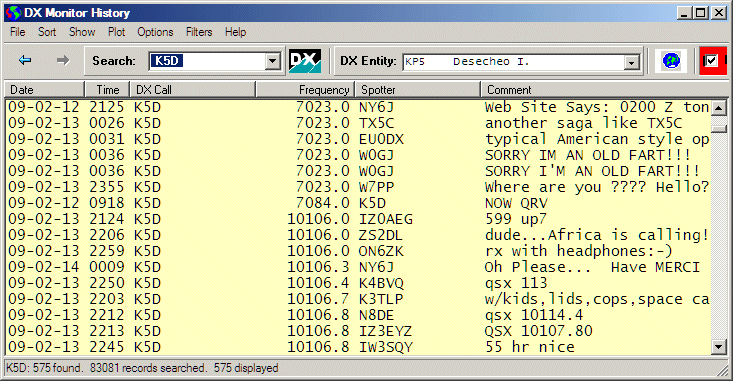
K5D Spot History sorted by Frequency
The History Window sorted by frequency shows their main operating frequency and the comments often show the QSX split frequency that made it through. DX Monitor can maintain a separate window that only shows the DXpedition spots while the main window shows all the DX activity.
Step 4
Map the spots by band to see who is hearing the DXpedition. You can immediately see if there have been any spots from your part of the world.
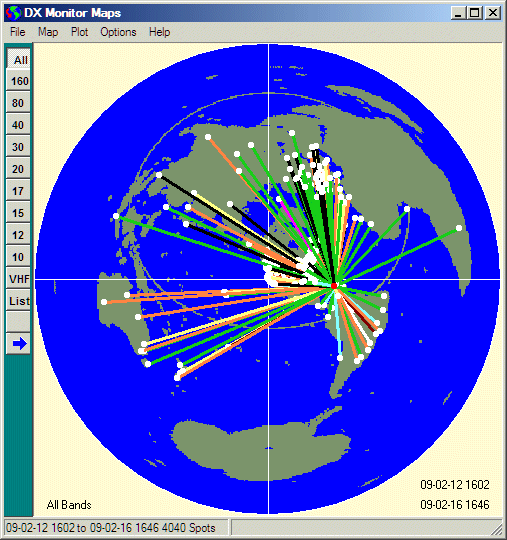
K5D Spot pattern
Step 5
Sort recent spots by distance from your QTH to the spotters to see what bands have been working from your part of the world.
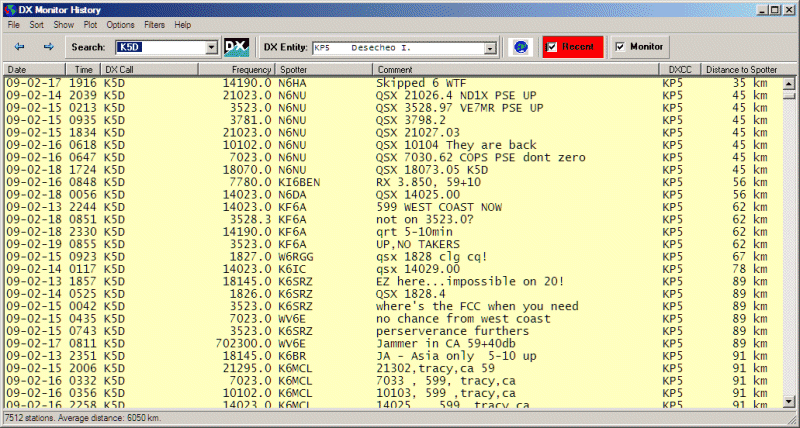
K5D Sorted by Distance to Spotter
Step 6
Use the twitter feature to send alerts to your phone by SMS message to alert you to activity on the difficult bands and modes.
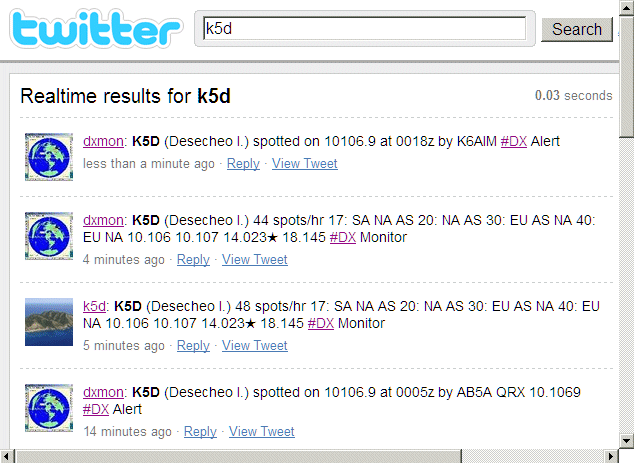
DX Spots from DX Monitor on Twitter
You can monitor spots and summaries on one or more #DX channels, or you can set up a private twitter channel to send the alerts from your home computer to your own cell phone.
DX Monitor is a standalone Windows program which monitors the DX announcements available on the internet at DX Summit, HB9DRV and connections to one or more local and international DX Cluster Telnet Servers.
New DX spots are displayed in the main window with user selectable bands, fonts, colors, and highlighting of alerts and local spotters. A band map tracks the current stations on the air by frequency. Maps show the openings with buttons to select bands and times.
The predicted signal strength of the spotted station at your QTH can be displayed with each spot. A 24 hour propagation prediction by band takes only one click.
DX Monitor builds a database of DX Spots, Announcements, and WWV information and includes many tools which can be used by DXers to improve their chances of working a new country.
Click for Screen shots and Introduction
What's New?
- Twitter Interface to send spots and DX summary information to a twitter account.
- Alerts by country, callsign, band or mode. Popups, color coded, or sms via twitter.
- Animated Google Earth Interface. Fly from spot to spot as each one arrives. Plot spots and propagation paths on Google Earth and Google Maps. Pinpoint US and Canadian amateurs. See antennas from space.
- Show Location Information and beam heading on each DX spot: Country, State, US County.
- Predicted propagation from your location to each spot. 24 hour instant forecast.
- Optionally filter by signal strength to only show stations you can work.
- Rig interface for instant tuning or intelligent scanning to monitor incoming spots.
Real Time Features
- Combines DX Spots from multiple web sites and telnet servers in one display.
- Check Propagation from your location to the DX using HamCap.
- View spots on a color coded Band Map.
- User defined frequency filters and color coding.
- Open paths plot automatically on Mercator and Azimuthal (Great-Circle) maps.
- Alerts for needed DX by callsign or DXCC entity.
 Hot Spots Button. One click lists the hottest DX being spotted by band.
- Click a call for recent spot history, QSL and station information, location, beam headings, sunrise times, Google searches and more.
- Graphic Display of WWV Solar Flux and Geomagnetic Indexes with 27 and 45 day forecasts.
Analysis Features
- Search and Sort the History Database by call, country, distance, heading, dates, distance to spotter, alerts, popularity, hourly rates and more.
- Plot any list of DX spots or log data on the maps.
- Activity Scatter Plots show DX activity on each band by hour or by day of the week.
- Animated Maps show changing propagation by hour on each band.
- Band and Hour Buttons for viewing of the spot maps by frequency and time of day.
- Convolve Plot to map 24 hours of observed propagation to your location.
- Load log files (ADIF or Cabrillo) for plotting, sorting, and counting countries, calls, US states and counties and more.
More Features
- Supports RAC Callbook and HamCall CDs and the free K4HAV FCC/VE Database.
- Minimize DX Monitor to run in the background in the system tray.
- Includes a complete Telnet Application for simultaneous connection to an unlimited number of Telnet Servers. Fully automated and integrated with DX Monitor.
- Personalized font styles, sizes and colors to suit your eyes and your computer screen.
- Access Atomic Time Servers to accurately set your computer clock.
- Show only spots from local spotters or highlight them.
- Plot Terminator (Gray Line) on maps in real or historical time.
Download the latest DX Monitor
DX Monitor is shareware. Try it free for 30 days. If you like it, buy now.
|
Join the DX Monitor Mailing List
Group members discuss new features and how to benefit the most from DX Monitor. Note that the Yahoo Group is ending and new discussions are on Groups.io |
|
|
|
|
|
Go to DX Monitor Group Discussion
|
|
Hosted by BenLo Park
