WWV Current Conditions
WWV History and Forecast Window
The WWV Window shows the WWV Numbers in graphic tabular form for the past month every 3 hours, and for previous months as a monthly average. It also incorporates the NOAA 45 day and 27 day forecasts. Click the WWV button, the WWV numbers on the toolbar, or open the WWV Window from the Window menu.
Before viewing the graphs, it is a good idea to update the WWV data using the Update Menu commands Get 250 WWV from HB9DRV and NOAA 27 and 45 Day Forecasts. This is only necessary the first time you use DX Monitor. If you use the Auto button on the main window, updates will be downloaded automatically when you are connected to the net.
Press the ESC key to cycle through the three WWV displays quickly.
Plot Menu
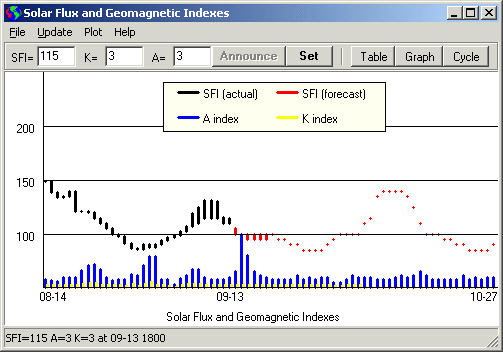
Current Data. This graph shows the past month and the next 45 days, thus it spans two and a half solar rotations. The Solar Flux Index (SFI) begins in black for historical data and switches to red for forecast data. Today's conditions appear at the change of color above today's date. There is a range in the forecast data where the 27 day and 45 day forecasts disagree.
The A-index is plotted in blue at the bottom of the chart. The K-index is plotted in yellow. The scale is doubled for the A and K index histogram.
To quickly switch from the graph to the Cycle Plot, press the ESC key or the Cycle button.

Comparison of Sunspot Cycles 21, 22, 23 and 24
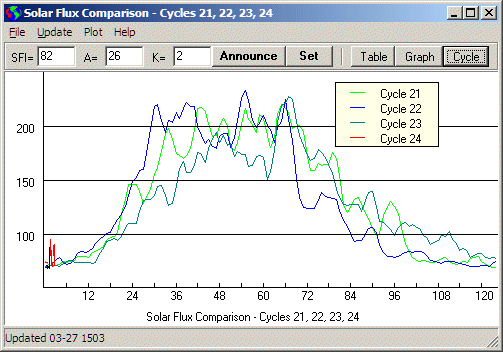
Cycles 21-24. We are currently in Sunspot Cycle 24, which began on January 4, 2008. To answer the question, How long do we have to wait before conditions improve?, this graph compares the solar flux of the current cycle with the observations from the previous three cycles. Cycle 21 began in June 1976 and lasted 123 months. Cycle 22 began in September 1986 and lasted 116 months. Cycle 23 began in May 1996 and will last until around the end of 2008, overlapping with the just begun Cycle 24. The graphs show a 90 day moving average of the historical data in order to smooth the chart and show the long term trends more clearly.
Following the Cycle 24 moving average data are the current observations, which are in black for actual values over the past month, followed by red forecast data for the next 45 days. Without the smoothing of a long term average, one can see the short term fluctuations around the long term trend line.
The numerical data used to plot the historical values comes from the Natural Resources Canada in Canada. More interesting graphs of previous years and cycles are available on the DX Listeners Club web site.
At the top of the window, in white, are the NOAA forecast numbers. The latest actual reported WWV Numbers are highlighted in yellow. Historical numbers are shown in blue.
Deleting Bad Data. It is possible for bad data to arrive when someone makes a typo entering the numbers at some packet cluster. If that happens, you can delete the line or lines by selecting them and pressing the DEL key.
Manually Entering Data. If the current WWV number is not displayed and you have heard it from WWV or downloaded it from the net, you can manually enter the numbers in the edit boxes at the top of the page. Press the Set Button to create the new entry. You can change the date and comment before the new line is created. By default, the comment contains your callsign.
Announcing WWV. You can send the latest WWV numbers via Telnet if you are connected to a cluster that has not received them from the network. This does not update DX Summit which receives its WWV data from another source.

Pressing the right mouse button will bring up a Popup Menu which can be used to edit the data.
Delete Selected Data. The row or rows of data selected (shown in yellow) will be deleted.
Edit Selected Data. Edit one or more rows. Make sure the resultant data falls correctly into the columns. Edit again if necessary.
Average Selected Data. The range of rows selected will be averaged to create an average date, time, SFI, A, and K value. The new row is added to the data list. Optionally, the old rows can be deleted. Normally, the program maintains 30 days of historical data and automatically deletes the details after this time. Average data is maintained back to the year 2000.
Save As. This allows you to save the data to a text file which can be loaded into Excel or other programs for analysis or graphing.
Graphs can be saved in GIF or PNG format and will be the same size as displayed when you save them. Resize the window first to get a higher resolution graph for printing or other uses.
Close closes the WWV Window. Pressing the Esc key will also close the window.
Get 25 WWV Spots from DX Summit. This command will retrieve the latest page of WWV numbers from DX Summit. If you have checked the Automatic DX Summit Downloads menu item in the Update Menu of the main window, this data will be checked automatically every 3 hours. If there is no new data available, the display will not change.
Get 50 WWV Spots from HB9DRV. This command will retrieve the latest page of WWV numbers from the HB9DRV Web Cluster. If you have checked the Automatic HB9DRV Downloads menu item in the Update Menu of the main window, this data will be checked automatically every 3 hours.
Get 250 WWV Spots from HB9DRV. This command will retrieve the latest 250 WWV numbers from the HB9DRV Web Cluster. Normally that is about one month's data and is needed to make the Graph of current data useful.
Latest WWV from WWV. The WWV numbers are available from the WWV website a few minutes after the top of the hour, which is about 15 minutes before they are broadcast on WWV. This data is displayed in the window, but does not automatically update the history file.
NOAA 27 Day Forecast. The 27 day forecast created by NOAA Space Environment Center is analysed and merged with the history data for display. The expected SFI and maximum expected A index are shown. This forecast is updated Tuesdays at 2212Z. See http://www.sec.noaa.gov/wwire.html for more information on this and other data available. If either of the automatic download options is checked, this data is retrieved automatically once a week.
NOAA 45 Day Forecast. The 45 day forecast created daily (and sometimes more often) by the USAF is analysed and imported into the history data. If either of the automatic download options is checked, this data is retrieved automatically.
NOAA 3 Year Forecast. The 3 year forecast is retrieved and displayed.
Sunspot Numbers. Some propagation programs use the actual sunspot numbers instead of the measured solar flux. Recently observed sunspot numbers and solar flux are shown in tabular form. The sunspot numbers have been empirically determined by Natural Resources Canada to relate to solar flux according to the formula N = (1.14).S - 73.21.
Space Weather. This is a shortcut which will take your web browser to the Space Environment Center of the US National Oceanic and Atmospheric Administration for graphs, photos and more information on solar conditions.
Historical Solar Flux Data. This will retrieve updated monthly average data for the History table and the Cycle graphs. The data originates from Government of Canada Spaceweather Solar Monitoring Programme. The new values are entered in the WWV History Table. Press the Table button to view them.
The status bar will show the latest monthly data added to the data set. Press Table, Graph, or Cycles to view the new data.
Refresh F5. Press F5 to refresh the WWV display information. If you have loaded one of the other pages, such as the Sunspot Numbers, F5 will bring back the WWV History.
Help. Pressing F1 or choosing from the Help menu will show this page.
The latest WWV numbers are displayed on the toolbar of the main window with arrows indicating the change from the previous actual numbers. Note that this is a change from DX Monitor 0.94 which drew the arrows based on comparison with a 24 hour moving average, leading to numerous emails from users asking why the arrow pointed up when the numbers moved down...